Claude Code Session Viewer: making coding agent behavior visible
What happens when custom tooling is built to observe how AI coding agents actually work? An experiment in understanding Claude Code through session-level observability.
| Tool | cc-session-viewer |
| Stack | React 18 · Vite 6 · Express |
The Observability Gap
When coding agents are used daily, sessions accumulate fast. Each one is a rich record of agent behavior — decisions made, tools invoked, reasoning explored, dead ends hit, course corrections taken. But all of this data lives in raw JSONL files buried in ~/.claude/projects/. Without a way to read it, the agent is a black box.
You see the terminal: a few prompts, a few responses, a final result. What you don’t see is everything in between.
Six terminal exchanges produce six checkpoints. What’s hidden inside each one:
- A handful of tool calls — file reads, edits, bash commands, searches — often single digits, occasionally reaching a dozen or more
- Thousands of tokens consumed per checkpoint, with rare spikes into the hundreds of thousands for complex, context-heavy steps
- Chains of reads, searches, and validations that precede a single visible edit

This is a real session — the one used to build this very post. It consumed 788k input tokens and 309k output tokens across 18 checkpoints. From the terminal, each of those 18 exchanges looked like a brief back-and-forth; the tool activity inside each checkpoint was not visible.
What Is cc-session-viewer?
cc-session-viewer is a local web application that parses, renders, and navigates Claude Code conversation logs. It reads the JSONL files Claude Code writes to ~/.claude/projects/ and turns them into a structured, navigable interface.
It runs entirely on your machine. No data leaves your computer.
How to install and run
Run instantly without installing:
npx cc-session-viewerOr install globally to keep the command available everywhere:
npm install -g cc-session-viewer
cc-session-viewerThe app launches at http://localhost:4000 and auto-detects ~/.claude as the session root. No configuration is needed to get started.
Why This Was Built
When Claude Code is used for hours each day, sessions accumulate quickly. Each session is a log of what the agent was asked to do and how it did it — but the logs are raw JSONL, unreadable without tooling.
cc-session-viewer was built to answer questions that the terminal alone could not answer:
- Which checkpoints were consuming the most tokens, and why?
- What exactly did the agent read before it made a change?
- When the agent “edited 3 files,” what was the full sequence — reads, searches, validations — that preceded those edits?
- How does one approach compare to another for the same task?
The fastest path to answering those questions was to build a window into the session data directly.
What It Shows You
The full checkpoint list
Every user prompt becomes a checkpoint — a labelled row in the main view showing the prompt, the number of tool calls it triggered, and a timestamp. Expanding a checkpoint reveals the full message sequence: the user turn, all intermediate agent messages with their tool calls, and the final response.
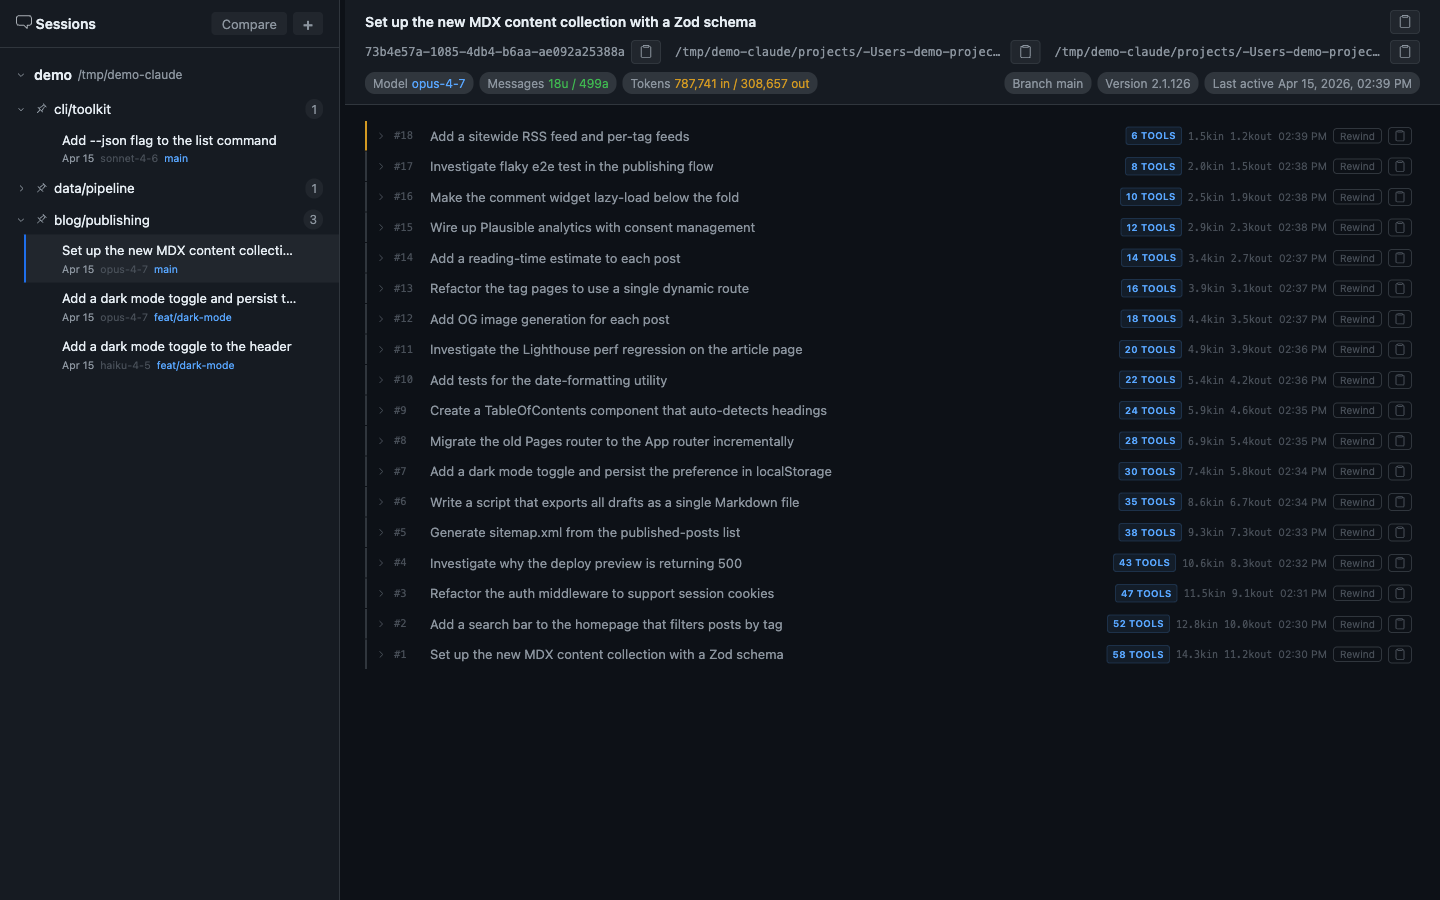
The sidebar organizes sessions by project, with metadata badges showing model, token count, git branch, and last-active time. You can pin frequently-visited projects to the top.
Collapsed tool call groups
Inside each checkpoint, consecutive tool-use messages are collapsed into a single labelled group: “22 assistant messages (22 tool calls).” Clicking expands the group to show every individual tool call — what was read, what was searched, what was edited, in what order.
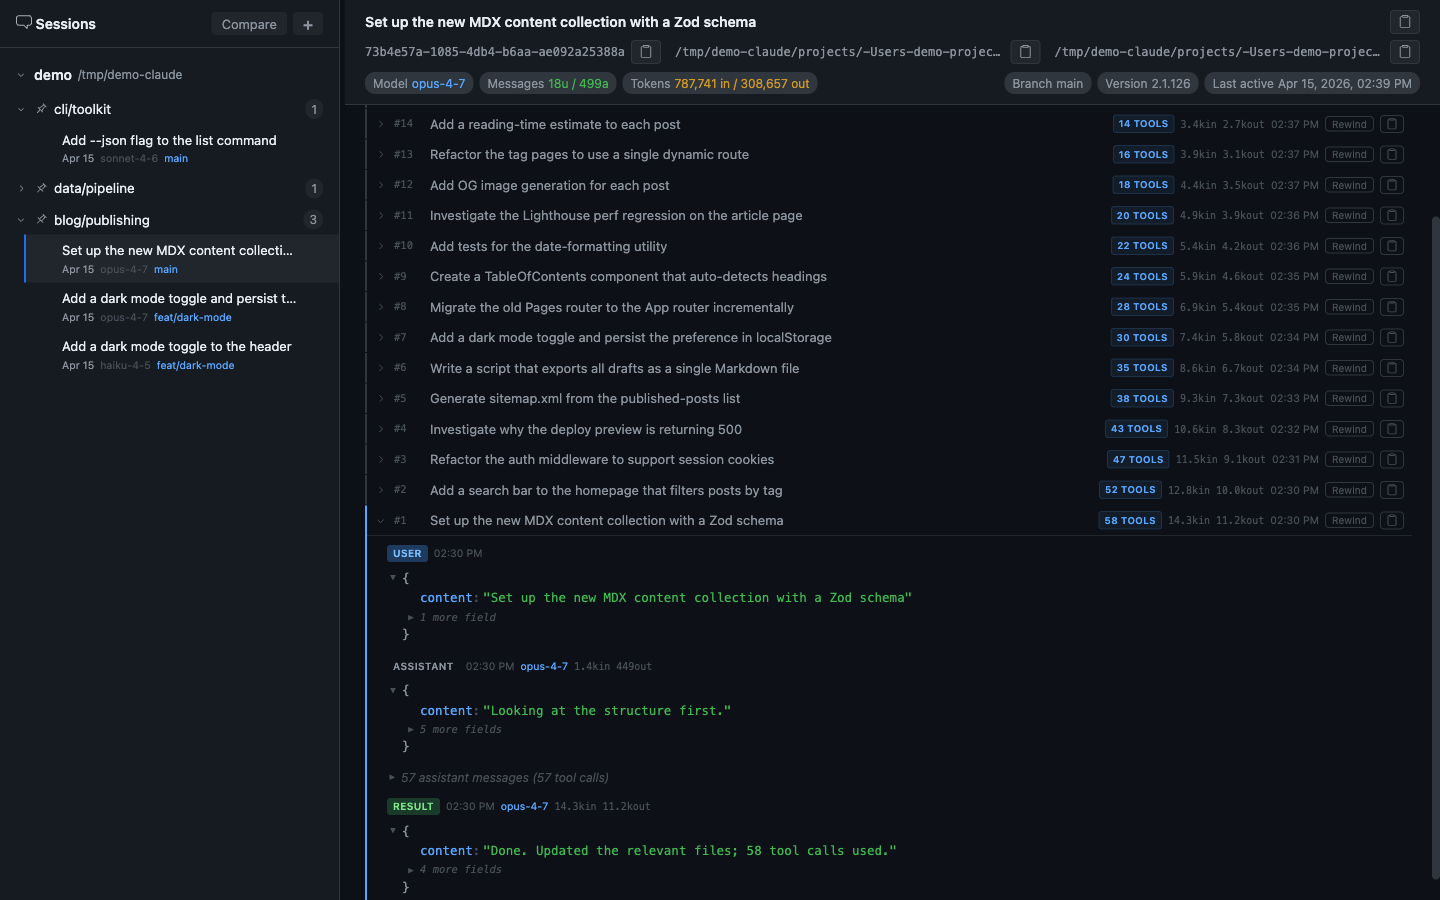
This single feature makes agent work far more legible. What looks like “Claude edited the file” is often 12 reads, 4 searches, 3 bash validations, then the edit.
Side-by-side session comparison
Enter Compare mode, select two sessions, and view them in independently scrollable columns. Each column shows that session’s checkpoint list with its own metadata header — model, message count, total tokens, branch, start time. You can expand checkpoints in either column independently.
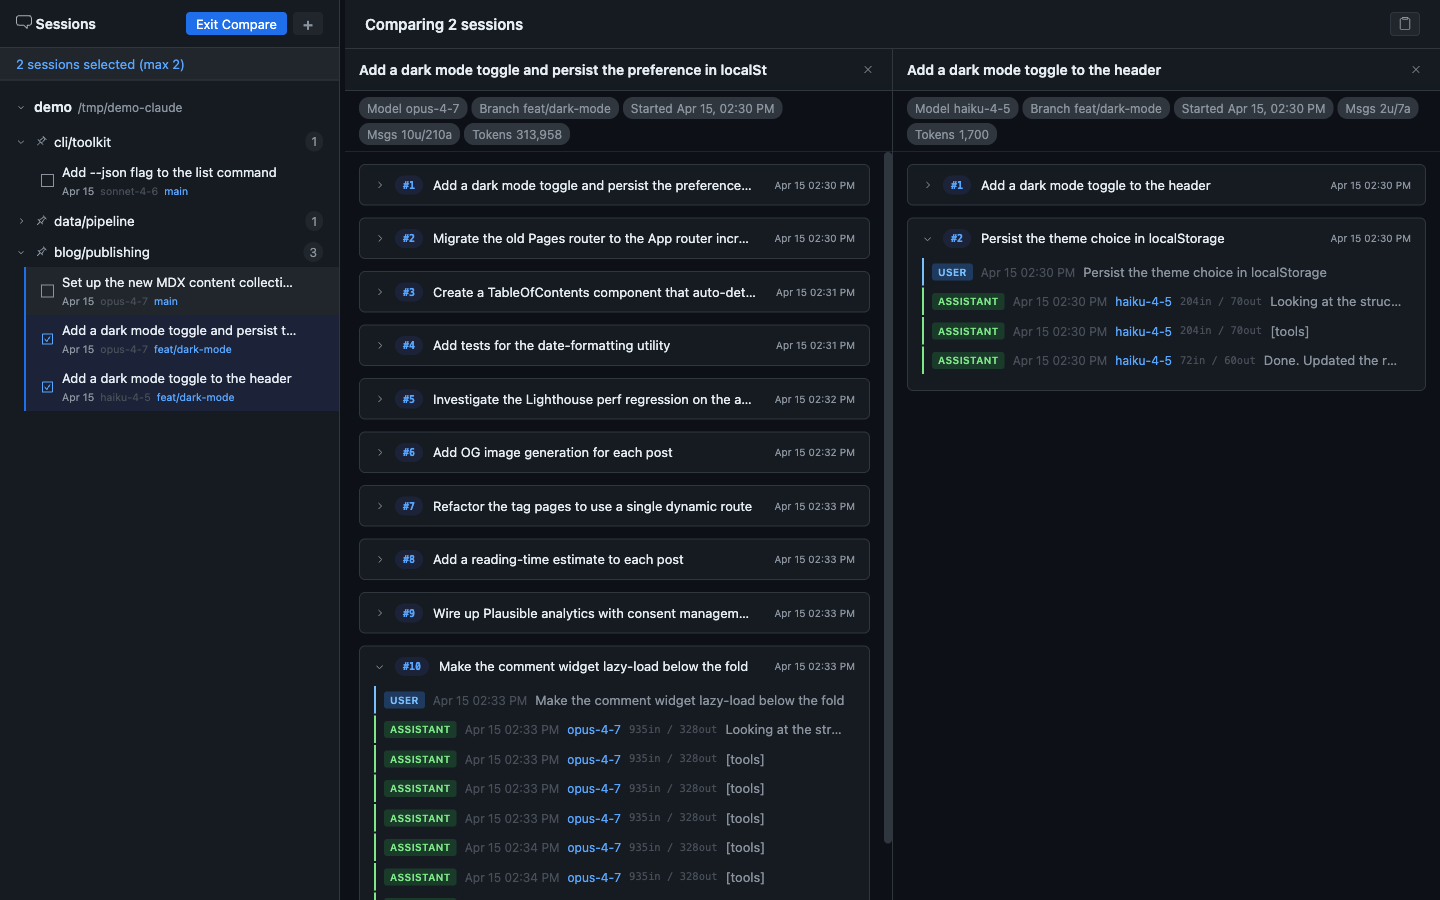
This is how you find out whether a cheaper, faster model handles a task just as well — or what specifically differs in the approach.
Capabilities at a Glance
| Feature | What It Does |
|---|---|
| Multi-root browsing | Browse multiple .claude folders, not just ~/.claude |
| Checkpoint grouping | Each user prompt becomes a chapter with all agent activity nested inside |
| Collapsible tool calls | Batch-collapse consecutive tool-use messages into a labelled group |
| Session metadata | Model, branch, version, message count, total tokens, last-active time |
| Session comparison | Select 2 sessions for side-by-side scrollable comparison |
| Rewind | Jump back to any checkpoint state |
| Copy transcript | Full session, per-turn, or comparison selection as plain text |
| Session rename | Give sessions meaningful titles rather than UUID filenames |
| Project pinning | Surface frequently-used projects at the top of the sidebar |
| Markdown export | CLI script to dump sessions to .md files for LLM ingestion or search |
Anatomy of a coding agent session
Sessions aren’t flat message lists. They’re trees. Each user prompt starts a checkpoint — a burst of agent activity (thinking, tool calls, intermediate reasoning) that terminates in a response. Understanding this structure is key to understanding agent behavior.
| Layer | What It Contains | Why It Matters |
|---|---|---|
| User prompts | The task or question | Sets the agent’s objective |
| Extended thinking | Internal reasoning before acting | Reveals the agent’s strategy and planning |
| Tool calls | File reads, edits, searches, bash commands | Shows the actual work being done |
| Sub-agent spawns | Delegated parallel tasks | Shows how the agent decomposes complex problems |
| Token usage | Input/output totals for the session | Maps the cumulative cost of the session |
| Compaction events | Context window management | Shows when the agent hits memory limits |
Patterns in Agent Behavior
What consistent patterns emerged from observing dozens of sessions through the browser:
The read-before-write pattern
Agents consistently read 3-5x more files than they edit. They build context before acting, and sessions that skip this phase have higher failure rates.
Thinking scales with ambiguity
Clear, constrained tasks produce short thinking blocks. Open-ended requests trigger extended reasoning that can consume 10x the tokens of the actual output.
Sub-agent spawning is strategic
Agents delegate when tasks are parallelizable and independent. Spawn patterns reveal the agent's implicit task decomposition.
Cache efficiency determines cost
Sessions with good cache hit rates cost 60-80% less than sessions with cache misses, but that strategy is invisible without token-level observability.
Failure recovery has a signature
When an approach fails, thinking blocks often summarize what was tried, identify why it failed, and pivot to an alternative.
Takeaways
Coding agents do far more than what's visible
The terminal shows prompts and responses. The session log shows the full decision tree: tool calls, extended reasoning, and sub-agent delegation.
Observability changes how you prompt
Seeing that ambiguous prompts trigger expensive thinking spirals naturally pushes prompts toward tighter constraints and clearer intent.
Sessions are an underutilized knowledge base
Every session contains what was tried, what failed, what worked, and why. With the right tooling, past sessions become future reference material.
The agent's architecture is visible in behavior
Tool selection, delegation, and cache management reflect implicit architecture. Observability makes those choices legible.
Build the tool you need to see
The fastest way to understand a complex system is to build a window into it, then use that window while the system evolves.